The Burndown chart teams use to track remaining work, It can be scaled to a different level like Epic Burn Down, Release Burndown, Sprint Burndown, etc. This article is on only the Sprint Burndown chart. Sprint Burndown Chart is a visual representation of remaining works for the scrum team of a specific sprint. Burn-down charts represent the real-time total amount of work as pending for the sprint of any team, the amount of work can be measured as remaining effort hours or story points. Using the unit as “task hours” rather than “story points” is always better for a burn-down chart. I suggest using task hours to plot the burn-down chart.
we will learn details about the burn-down chart, with the below-mentioned points
- How burn-down chart gets generated and what exactly does it represent?
- How to read the burn-down chart?
- Scenarios when we refer to our burndown chart to make a decision.
- Read team performance from the burndown chart and define action items
- . Disadvantages of using Story points as burn-down measurement units.
How burn-down chart gets generated and what exactly does it represent?
Burn-down Chart is a sprint artifact, every sprint has its individual burn-down chart, ALM tools generate the burn-down chart for each sprint right after sprint planning or when any sprint starts. If you are not using any ALM tool, then you need to manually create your burn-down chart on excel or whiteboard based on your convenience.
A burn-down chart has two major value areas, X-axis and Y-axis, X-axis represents the number of days for the sprint, and the Y-axis represents the amount of work. The value within the graph is the remaining work (let’s take it as hours) for any specific day within the sprint duration.
To understand this in more detail, refer to the below image followed by the explanation of the picture.

If you look into the above picture, we can notice the team has a product backlog, and during sprint backlog, the team has committed a few user stories, and later the team members have distributed the task, each member will work on with an estimated effort hour for each task. So far we have committed stories for the sprint, Each story has some tasks with estimated hours, and each task is assigned to respected team members. (We are not talking about story points here, as this article will talk about a burn-down chart with Task hours.) If you total the task hours it will be somewhere at 110 hours. let’s assume the team has a capacity of 130 hours, which we will bring into the picture a little later. Let’s see the other important are of the sprint, we have a sprint start date that is the 10th Dec and it is ending on the 21st of Dec, which means it’s a two-week sprint, and the sprint duration is 10 days. So from all that information, we will pick or the ALM toll will pick two major values (as below) to plot the burn-down chart for the first time
- Total Days of the sprint = 10 days
- Total committed & estimated task hours for the team = 110 Hours
If we divide the total hours by the total day’s means (110 /10 ) = 11 hours.
This says, if the team completes 11 hours of work daily, then by end of the last day of the sprint, the team will be able to complete all the work they have committed.
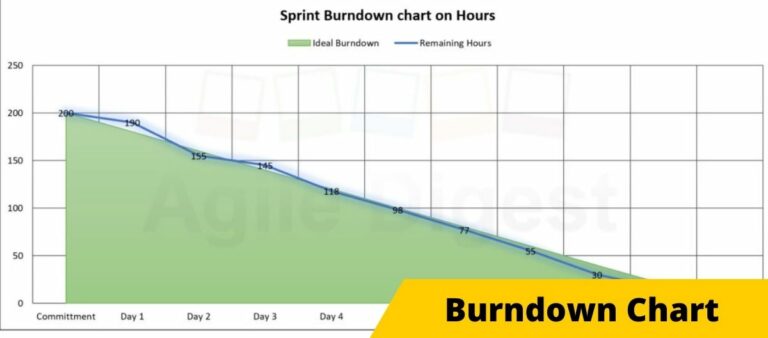
refer to the picture below followed by the instruction to understand it better.

As we learned, based on the example of the current sprint, the team needs to work 11 hours per day. By end of the first day, the team will be able to complete 11 hours of work from 110 total hours. so the remaining total hours will be 110 – 11 = 99 hours by end of the first day. And similarly, by end of the 2nd day, the remaining hours of work will be 99 – 11 = 88 hours. In this fashion, by end of the last day, the remaining hours of work will be zero.
This is the future prediction, where the ALM tool or your excel predicts that the team will be able to work for 11 hours every day and all that 11 hours will be reduced to the remaining hours accordingly, the line on the predicted value on each day is called Ideal line of the burn-down chart. Which get plotted on the chart on the first day of the sprint, the lines start from day one to the end of the last day.
But in reality, the remaining hours at end of every day will not be the same as predicted, because of the following reason.
- Even after working 11 hours or more, it’s not necessary for the remaining hours will reduce by 11 hours, because 11 hours was just the estimation, once the team starts working on the real construction, the actual hours may differ from the estimate. In agile what is important is, that we don’t care about how much work we have done, we care about how much amount of work is pending or remaining. keeping that mantra in mind, everyone updates the remaining hours for each task they have worked on. Now the system (ALM tool or your Excel) will calculate the total of remaining hours by end of the date, and get them out of the total estimated hours, how much is burned down. If the total remaining hours on day one is let’s say 105 hours, so the total burn down on day one is 110 – 105 = 5 hours. wherein the Ideal line was 11 hours.
- There are possibilities of Scope creep due to product owners’ critical priority changes. which will increase or decrease the remaining hours suddenly, resulting in a sudden rise or fall of the actual line.
- team members fall sick, that day the tasks assigned to the member may not be burned down
- Impediments, the blocker like external dependencies, development environment, etc may slow down the predicted momentum of burn down.
- and many other reasons.
So the system calculates the actual remaining hours up to the current date or sprint last date (whichever is smaller), and plots a line which is called the Actual burn down the line
refer to the below picture to understand how actual burn-down lines flow on the burn-down chart


There is one more line that is very useful if you have it on your burn-down chart. That is called the Capacity burn-down line. So if we talk about the above example, the team has committed a total of 110 hours of work for a 10 days sprint, where let’s assume the team had a capacity of 130 hours. The Ideal line was plotted based on the commitment of 110 hours ( 11 Hours burn down every day). For capacity burn down we can plot another smooth line based on the available capacity of 130 hours (13 hours burn down every day). This line is very important, will learn its importance later in this article, So far Rally or Jira does not provide this line on their burn down, however, the burndown chart in TFS has the capacity line.
Refer to the below picture to get a visual of the capacity burn down the line.


How to read the Burn-down Chart?
I believe you are all already aware of the sprint burn-down chart, and referring to it to track the progress and remaining work in the rest of the sprint days. Here I will explain a few of the areas to understand how to read the burn-down chart. If you are new to agile or want to know more about burn-down, you may find it helpful. As we know our burn-down chart has an ideal line and an actual line. you may have another line for the capacity line. Whenever we refer to our burn down we check our actual line as of today and compare it with the ideal line.
- If the actual line ends anywhere above the ideal line, it means there is a risk of completing all the stories within the sprint duration. How big the risk is depends upon the vertical distance between the actual line endpoint and the ideal line.
The higher the distance is bigger the risk because as per the commitment, the remaining hours on that day are actually more than what is supposed to be. - There can be many reasons for that and the need to take corrective action, as a proactive measure. reasons like
a.) The team is not able to give enough time to the sprint commitment.
b.) The team has underestimated the tasks.
c.) The team is not properly updating the remaining hours.
d.) The team is getting new stories after the sprint start date.
e.) The team is re-estimating the tasks hours, by increasing the remaining hours
At the same time, you need to check how many days in the sprint are remaining to recover the delay. If this situation appears during early sprint days, the team still has a chance to recover it, however, during the last days of the sprints, it’s very difficult to adjust the delay.
The below two diagrams represent two different cases where one diagram says the risk is minimal, and another one represents high risks
.
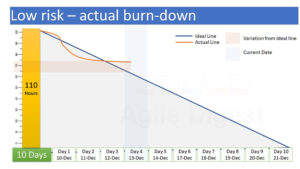
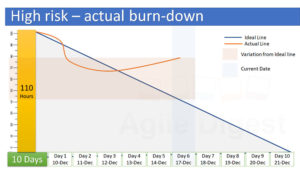
The rectangular box will not be there in your burndown. I sketched it here for better understanding, the light orange rectangle is the size of risk.
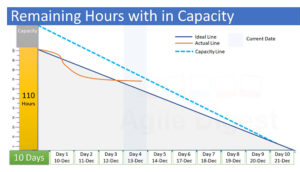
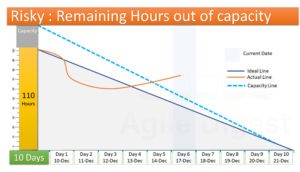
If you have the capacity line with your burn-down, you can get better visibility to identify the probability of resolving the risk. Even if the actual line is above the ideal line, but it’s below the capacity line, that means the team will be able to complete the tasks, as it is still under their capacity.
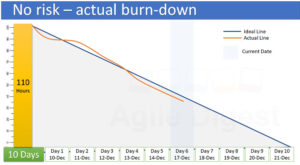
The below two diagrams represent two burn-down charts one is a risk zone another is not at risk on that particular day
2. Now let’s talk about another situation when the actual line is always under the ideal line. It’s a good sign, but if it is too low, then the team might have overestimated, and be capable of working on more work for the sprint duration. Look at the situation. A good mature actual line should be close to the ideal line, if it is not then there is something that needs intervention.
3. If you notice a sudden spike up or done on your burn down, then it means the team is getting too much scope creep.
This is how you will read your burndown chart, during our next section will see how we can read our burndown chart in different scenarios.
Scenarios when we refer to our burndown chart to make a decision
Scenario 1: The Product Owner asked to add one story as it is of high priority, and the functionality of this story is very critical to deliver by this sprint end.
In this case, the team needs to check the current burndown chart and the actual line. How much additional bandwidth do they have as of that specific day? There can be 3 scenarios :
- The Team can straightway agree to the story addition to the current sprint
If the actual line ends much below the ideal line or capacity line, means having enough bandwidth available to finish the job within sprint duration.
Keeping in mind individual capacity from the tester and development perspective. This means even if the whole team there are a lot of bandwidth available, at the individual tester level there is not much bandwidth available, so in this case, you might refer to option 2 below.
So you will first look into your burndown, if it says you can commit more stories, check for other constraints and take the decision.
- Or the Team can ask the PO to descope some low priority stories, which means remove from the current sprint and moving it back to the backlog
If the team finds in burn down the actual line is close to the capacity line or ideal line, then the team checks the similar size of already committed stories which are not yet started development, asks the product owner to agree on de-scoping any(one or more) of those stories, to accommodate new critical stories.
Keep in mind, the time remaining in a sprint, the skill set required for the new story, and the available bandwidth of those skilled team members.
- The team expresses it will be risky to add new stories to the sprint scope, and advised not to change the scope.
If the team reaches the end of the sprint there are only two to three days left, the actual line is very stable, few stories are already completed, and few are in progress. In that case, taking new stories may be risky, the team can explain to the product owner and suggest waiting for a few more days to start the next sprint, and the team will complete this story as first priority, and make it deploy-ready as soon as possible.
However even if it is the last few days of the sprint duration, all the stories of current are completed and accepted. The actual line already touched the ground. Then the team can quickly estimate and commit the story
Scenario 2: One of the resources needs to go on sick leave for a medical emergency for a couple of days.
In this case, check the burndown chart and analyze the position of the actual line endpoint. if it is ending long under the ideal line, You may accommodate the unplanned vacation.
Check on an individual level also total hours of pending work the resource has, and the total number of days remaining for the sprint.
Check if any other member of the same skill member has enough bandwidth to supplement the gap.
If the team feels there are potential chance of not completing all the committed stories, Then the team should immediately inform the PO, and reach a conclusion like identifying a less priority story to start the last thing of the sprint, etc.
Scenario 3: During the 2nd week of the sprint testing team raised too many bugs, that need to be resolved within the sprint duration.
If the tester is raising too many bugs during the testing of user stories, which is not a good sign of mature development, even if it happens. Check you an actual line and capacity line difference. How comfortable the team is able to fix the bugs, along with the pending committed development work. The tester needs to re-test the big fix along with committed testing work.
The burndown should have enough bandwidth, which means the actual line should end much lower than the capacity line, to work on all the fixes. If Not, then next sprint onward, keep enough buffer as a focus factor during your capacity planning.
Check your definition of done (DOD) about Defect closure, If it says All P1 and P2 bugs must close to make a story done. Check the number of P1/P2 bugs, the additional time to fix them, and the bandwidth available in your burndown.
Consider talking with your PO, to act out the worst-case scenario, and identify the lowest priority story and most critical stories.
The Burndown chart is the first place to decide whether you should talk to your PO now? or if you need to drill down the possible other constraints.
There can be many other scenarios in your work, and you may find a burndown chart is helpful to make decisions in those situations.
Read team performance from the burndown chart and define action items
There are many trends in sprint burndown charts and actual lines. Explain a few typical unusual cases of a sprint burndown chart, and explain what that causes and corrective actions.

You might have encountered your team sprint burndown having straight lines for a couple of days. That can be caused by one or more of the following reasons
- The team is not updating the remaining task hour on a daily basis
- The team has not created all the tasks, so not able to change the remaining hours
- Task estimation was underestimated, so the remaining hour is not changing
- user stories are blocked by some impediments and those are not resolved, so the team is unable to proceed
- An environmental issue like the development server not being available to do coding or the test environment not accessible for testing
How do resolve them?
- Make sure each and every team member update the remaining hours of the task they are working on a daily basis.
- During Tasking of a user story, don’t take it lightly, take your time to create and estimate tasks as accurately as possible.
- Try to resolve the impediments, as soon as possible, if some stories are blocked, don’t wait for their resolution, start working on the stories, if all the stories are blocked and that may take a couple of days to resolve, inform the Product Owner and act accordingly.
- Before starting the sprint map all your dependencies, resolve the dependencies first then commit the story, till the time the dependencies are not resolved work on independent stories.
- Resolve all environmental issues, and check availability and accessibility before starting the sprint.

If you notice that the actual line is touching the ground much before the ideal line, that means one or more of these.
- The team has worked aggressively, burned more hours per day as per the capacity
- The Team has committed less than the capacity
- The team has overestimated the task.
Resolution.
- If the team willingly works hard, it’s good, but it’s always better to have defined hours of work to be done. working extra hours every day may cause other negative effects. Plan your capacity based on the best-optimized amount of work the team can perform.
- If the team commits less than the capacity, that happens because most of the time because of an insufficient amount of requirements, the Product Owner may not have enough story ready to commit at the time of planning. Work on frequent and regular grooming to have your backlog healthy.
- Estimate fare, and make it as accurate as possible

If you notice that your actual burn-down line has a sudden spike upward, it means there are
- change on scope (Scope Increased between sprint duration), Your PO may have asked to add one or a few stories to the current sprint.
- Or the team has re-estimated the task to increase the remaining work.
Resolution
- Mature up your Sprint Planning, Have your backlog healthy so that you can fully utilize your capacity during sprint planning, by committing max possible product backlog item in priority.
- Do a task breakdown thoroughly, and create all the possible tasks created, estimated, and assigned. so that you don’t need to re-estimate during sprint duration.

If your ideal line and capacity line have a big distance means, The team has not committed their full capacity. because of
- Unavailability of enough user stories in a ready state, so the team has ended up with the sprint planning
- or the Team is not confident in utilizing the full capacity, hence only partial capacity.
How to resolve this situation for future sprints.
- Again Continuous backlog grooming to have a healthy backlog of ready work on Items.
- Understand the requirements in detail covering all aspects. Then only commit the user story during sprint planning. Let individual team members create, estimate, and assign tasks for them. continue the planning till the maximum capacity is utilized.

This state is very risky, and a clear indication that the team will not be able to complete all the committed work items by the end of the sprint. This cause because of many reasons like
- Even the team is working as expected, but they are not updating the remaining hours.
- The Team is actually not working
- The Team is blocked or impeded.
- The team has found that estimated task hours are too low, and needs to work more, instead of re-estimating the task, they are not updating the remaining hours, working to bring the remaining hours as per burn down.
How to resolve this case, for this sprint or Future sprint.
- Please update the remaining hours every day, it may bring some spike, and it will depict the real picture.
- The rest of the resolution of the case varies from team to team, analyze it and take a best-suited corrective action.


This is the typical case, you might have encountered, The reason behind this can be because any of these reasons
- Mostly occurs, when the team uses story points as the y-axis of their burndown.
- remaining work updates are not happening, regularly.
- remaining work updates happen only on the last date of the sprint as a formality.
How to work on this
- Start task breakdown, and have the Y-axis of your burndown with task hours.
- Update Remaining hours on a daily basis.
We will talk about why we should not use story point as the Y-axis of our Sprint burndown in the following section
Disadvantages of using Story points as burndown chart measurement units.
The purpose of the Sprint Burndown Chart is to track the remaining amount of work, It has to be referred to every day, and the team makes the strategy of the work they will perform for the day. So every day it has to burn down.
In the case of Story Points, it’s not necessary every day one story will get completed, even though the team has already worked on it and burned some work. So even though the work has burned down, the chart of burndown on story point will now reflect any changes. A story with any story point let’s say 5 SP can either be completed or not completed, it will not burn as 5 to 3 to 2 to 1. Once the story is completed the story point will remain the same as 5, only the state will change. So you will see a zigzag burndown instead of a real reaming amount of work as of that specific day.
The Stories are counted as completed when it is verified and accepted by the Product Owner. many times development and the testing completed story does not get verified by the product owner, as the Product Owner along with the development team has not started working as a team and the PO gives priority to other activities, which creates a delay in the story acceptance. and results become visible on your Sprint burndown chart.
Remember this article is only on the Sprint Burn Down chart. The Epic and Release burndown can be plotted using Story Points.
Below are three sample sprint burndown charts, to refer to and compare differences between sprint burndown on Hours and Story Points.


For more posts like this follow Agile Digest social Pages or subscribe our newsletter:
Wesbite: https://agiledigest.com/
Facebook: https://www.facebook.com/agiledigest/
LinkedIn : https://www.linkedin.com/company/agiledigest/
Youtube: https://www.youtube.com/@AgileDigest


